Why Your Sample Is the Foundation of Your Research
Every credible research study rests on one critical pillar — the quality of its sample.
You can deploy the most sophisticated statistical tools available. You can write perfectly worded survey questions. But if your sample is flawed, your conclusions crumble.
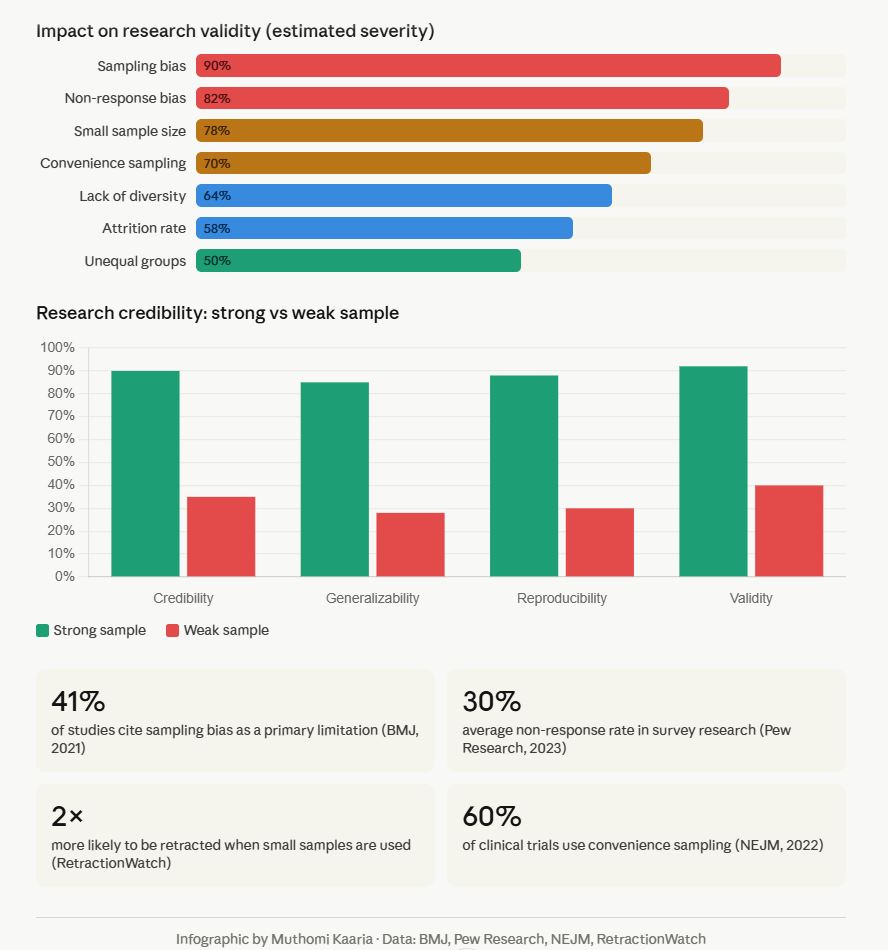
According to the British Medical Journal (2021), 41% of published studies cite sampling bias as a primary methodological limitation. The American Statistical Association confirms that non-representative samples remain among the top threats to external validity in social science and health research.
This article breaks down seven major sample limitations, explains why they matter, and gives you actionable fixes for each.
What Is a Sample Limitation in Research?
A sample limitation is any characteristic of your chosen study group that restricts the accuracy, representativeness, or generalizability of your findings.
Researchers often acknowledge limitations in a dedicated section. However, acknowledging a limitation is not the same as controlling for it. Understanding each limitation before data collection gives you the strongest protection.
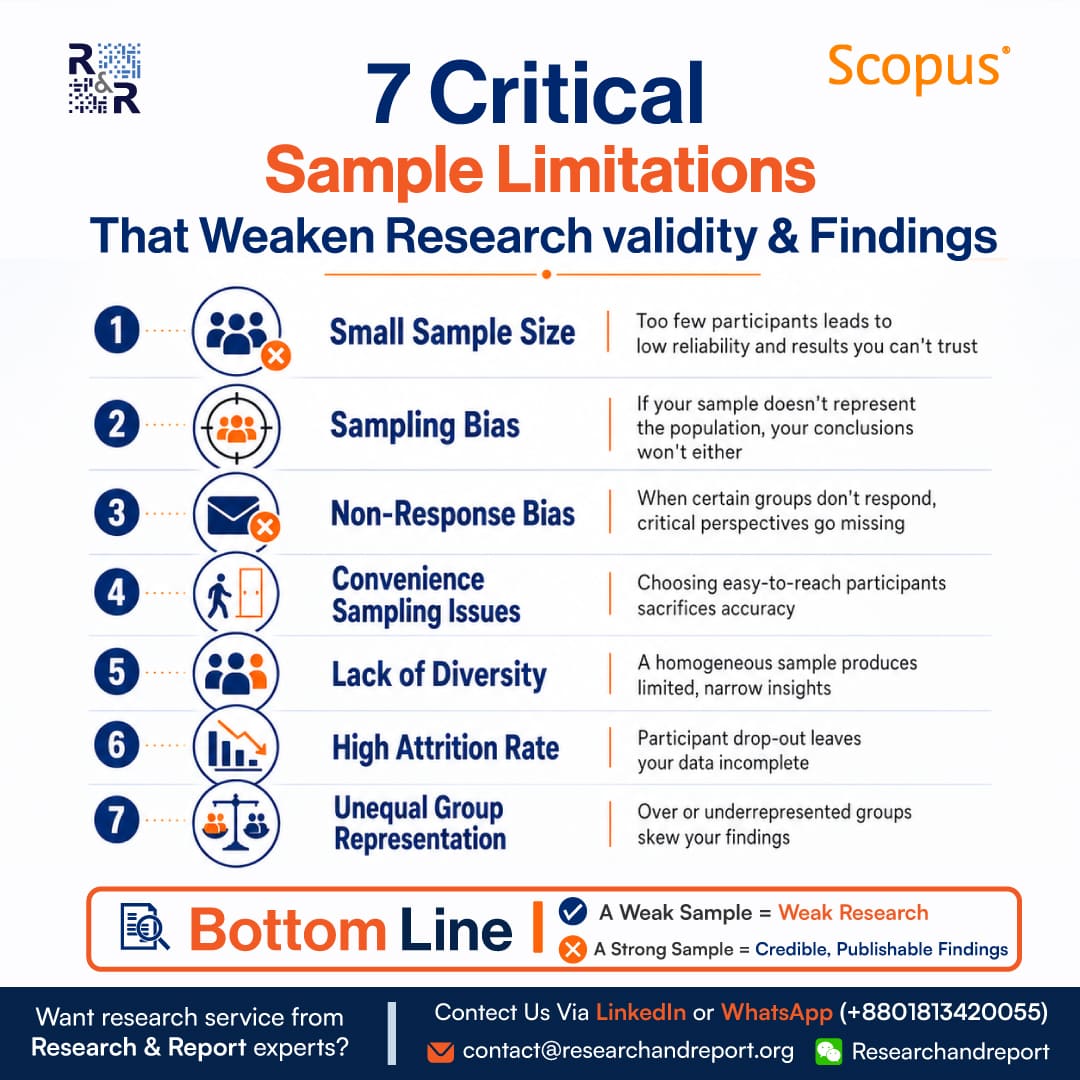
7 Critical Sample Limitations Explained
1. Small Sample Size — The Reliability Killer
What it is: When a study uses too few participants to detect statistically meaningful effects.
Why it matters:
- Increases the margin of error significantly
- Reduces statistical power, making it hard to find real effects
- Makes results sensitive to outliers and anomalies
A landmark analysis in Nature Human Behaviour (2022) found that underpowered studies — those with fewer than required participants — replicate successfully only 36% of the time, compared to 85% for adequately powered studies.
The fix: Use a power analysis before data collection. Tools like G*Power (free software) help calculate the minimum sample size needed for reliable results. For most social science studies, a minimum of n=30 per group is the accepted baseline.
Reference: Lakens, D. (2022). Sample Size Justification. Collabra: Psychology. https://doi.org/10.1525/collabra.33267
2. Sampling Bias — Distorting the Whole Picture
What it is: Sampling bias occurs when certain members of the target population are more or less likely to be included. Your sample does not accurately mirror the population.
Why it matters:
- Overrepresents or underrepresents key subgroups
- Produces conclusions that don’t apply to the real world
- Often invisible unless you track demographic data carefully
The famous 1948 Gallup polling failure — predicting Dewey would defeat Truman — is a textbook example of sampling bias caused by telephone-only sampling when most working-class voters lacked phones.
The fix: Use probability sampling methods — simple random, stratified, or cluster sampling. Stratified sampling, in particular, ensures proportional representation across key demographic groups.
Reference: Bethlehem, J. (2010). Selection Bias in Web Surveys. International Statistical Review. https://doi.org/10.1111/j.1751-5823.2010.00112.x
3. Convenience Sampling — The Speed Trap
What it is: Selecting participants based on accessibility — whoever is easiest to reach — rather than representativeness.
Why it matters:
- Common in academic research due to resource constraints
- Consistently overrepresents WEIRD populations (Western, Educated, Industrialized, Rich, Democratic)
- Limits generalizability beyond the immediate sample
A Behavioral and Brain Sciences review (Henrich et al., 2010) revealed that 96% of psychology study subjects came from Western countries — representing only 12% of the global population.
The fix: When resources limit probability sampling, use quota sampling to ensure minimum representation across key demographic categories. Always explicitly acknowledge the convenience sample in your limitations section.
Reference: Henrich, J., Heine, S. J., & Norenzayan, A. (2010). The weirdest people in the world? Behavioral and Brain Sciences. https://doi.org/10.1017/S0140525X0999152X
4. Non-Response Bias — The Silent Distortion
What it is: When a significant portion of selected participants do not respond, and non-respondents differ systematically from respondents.
Why it matters:
- Pew Research Center (2023) reports average survey response rates have fallen from 36% in 1997 to under 6% today
- Those who don’t respond often share unrepresented characteristics — lower income, distrust of institutions, or time constraints
- Creates a self-selected sample within your intended sample
The fix: Use follow-up reminders, multiple contact methods, and incentives. Compare early vs. late respondents as a proxy for non-respondents. Report your response rate transparently.
Reference: Pew Research Center (2023). Response Rates in Telephone Surveys. https://www.pewresearch.org/methods/
5. Lack of Diversity — The Insight Gap
What it is: Your sample is homogeneous — most participants share the same gender, ethnicity, age group, socioeconomic background, or geography.
Why it matters:
- Findings cannot be generalized across different population segments
- Critical in health research — the National Institutes of Health (NIH) reports that historically, 80% of clinical trial participants were white males, leading to medical guidelines that worked poorly for women and minorities
The fix: Design your study with diversity quotas from the start. Partner with community organizations. Use multilingual survey instruments to reduce language barriers.
Reference: NIH Office of Research on Women’s Health. (2022). Inclusion of Women and Minorities in Clinical Research. https://orwh.od.nih.gov/
6. High Attrition Rate — Incomplete Data Crisis
What it is: Participants drop out of a study before it concludes, especially damaging in longitudinal or multi-stage research.
Why it matters:
- Introduces survivorship bias — only certain types of people complete the study
- Reduces sample size below originally powered thresholds
- Can systematically skew results toward those with stronger motivation or resources
A Cochrane review (2020) found that attrition rates above 20% in clinical trials significantly alter reported outcome effects in most cases.
The fix: Keep participants engaged through regular communication, reasonable time demands, and completion incentives. Perform intent-to-treat analysis to account for drop-outs statistically.
Reference: Higgins, J.P.T. et al. (2020). Cochrane Handbook for Systematic Reviews of Interventions. https://training.cochrane.org/handbook
7. Unequal Group Representation — The Balance Problem
What it is: In comparative studies, some groups have far more participants than others, making cross-group comparisons unreliable.
Why it matters:
- Imbalanced groups produce unstable estimates for smaller groups
- Statistical tests like ANOVA assume roughly equal group sizes
- Can lead to Type I or Type II errors in group comparisons
The fix: Use stratified random sampling to control group sizes. When imbalance exists post-collection, apply weighting adjustments or resampling techniques such as SMOTE for quantitative studies.
Reference: Field, A. (2018). Discovering Statistics Using IBM SPSS Statistics (5th ed.). SAGE Publications.
How to Build a Stronger Sample: A Quick Checklist
- Run a power analysis before data collection begins
- Choose probability-based sampling over convenience methods
- Set demographic quotas to reflect your target population
- Track and report response rates transparently
- Build diversity into participant recruitment from day one
- Plan for attrition — recruit 20–30% more than your minimum target
- Use statistical weighting to correct for known imbalances
The Bottom Line
A weak sample does not just limit one study — it contributes to a body of flawed evidence that shapes real-world decisions, policies, and practices.
Methodological rigor at the sampling stage is non-negotiable for credible research. The good news: most of these limitations are preventable with planning, not just acknowledgeable after the fact.
References
- Lakens, D. (2022). Sample Size Justification. Collabra: Psychology. https://doi.org/10.1525/collabra.33267
- Henrich, J., Heine, S.J., & Norenzayan, A. (2010). The weirdest people in the world? Behavioral and Brain Sciences. https://doi.org/10.1017/S0140525X0999152X
- Bethlehem, J. (2010). Selection Bias in Web Surveys. International Statistical Review. https://doi.org/10.1111/j.1751-5823.2010.00112.x
- Pew Research Center. (2023). Response Rates in Telephone Surveys. https://www.pewresearch.org/methods/
- NIH Office of Research on Women’s Health. (2022). Inclusion of Women and Minorities in Clinical Research. https://orwh.od.nih.gov/
- Higgins, J.P.T. et al. (2020). Cochrane Handbook for Systematic Reviews. https://training.cochrane.org/handbook
- Field, A. (2018). Discovering Statistics Using IBM SPSS Statistics (5th ed.). SAGE Publications.
- Nature Human Behaviour. (2022). Replication rates in underpowered studies. https://www.nature.com/nathumbehav
Over to You
Which of these seven sample limitations have you encountered most in your own research or academic work? Have you found an effective fix that isn’t covered here? Drop your experience in the comments — your insight could help a fellow researcher.
Need research service from Research & Report experts? Please get in touch with us.