Likert scales remain a staple in social science, management, and policy research. Their simplicity—“strongly disagree” to “strongly agree”—makes them appealing for capturing opinions. Yet, their misuse often leads to statistical pitfalls that undermine credibility.
This article explains the risks, provides solutions, and highlights best practices with supporting evidence.
Why Likert Scales Are Popular
- Easy to design and interpret
- Widely used across disciplines
- Effective in capturing attitudes and perceptions
Despite their popularity, misuse of Likert data produces false confidence in results.
Common Statistical Risks with Likert Data
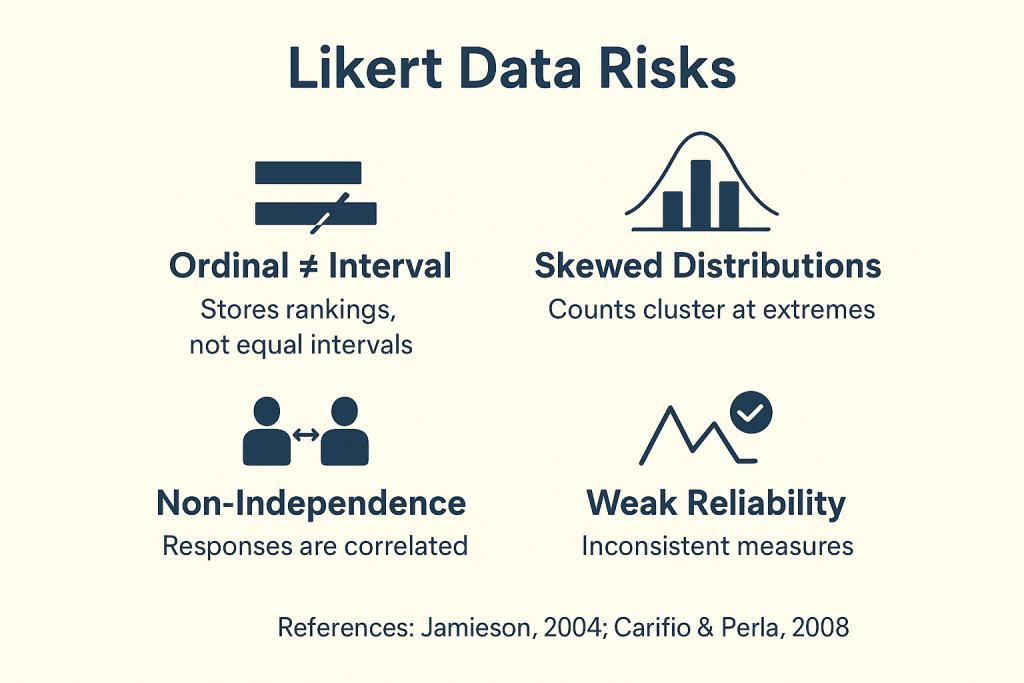
1. Ordinal Data Misinterpreted as Interval
A 1–5 Likert scale is ordinal. “3” is not mathematically twice as strong as “1.” Yet researchers frequently apply t-tests, ANOVA, or regression as if distances are equal. This misclassification inflates effect sizes and distorts findings (Jamieson, 2004).
2. Ignoring Normality Assumption
Parametric tests assume normal distribution. Likert data, however, is often skewed, with clusters at “agree.”
Ignoring this violates core assumptions and increases Type I errors (false significance).
3. Overlooking Independence of Observations
Responses are rarely independent. Cultural or organizational bias creates intra-class correlations. Without correction, test statistics appear stronger than they are.
4. Weak Scale Reliability and Validity
Using a single Likert item to measure complex constructs like trust or satisfaction undermines validity.
Robust research requires reliability checks such as:
- Cronbach’s Alpha
- McDonald’s Omega
- Factor Analysis

Figure: Likert data risks. Source: Jamieson (2004); Carifio & Perla (2008)
Best Practices for Likert Data Analysis
At Research & Report Consulting, we recommend:
- Use Non-Parametric Tests: Mann–Whitney U, Kruskal–Wallis, or ordinal logistic regression.
- Test Reliability: Apply Cronbach’s Alpha, Omega, or EFA to validate constructs.
- Aggregate Responsibly: Use multi-item validated scales, not single indicators.
- Report Transparently: State assumptions, tests applied, and limitations.
Why It Matters
- Inflated p-values mislead research findings.
- Spurious correlations weaken trust in evidence.
- Poor policy decisions waste resources.
A poorly analyzed Likert dataset is not evidence. It’s numerical storytelling.
Final Thought
Likert scales remain powerful tools—but only with methodological rigor.
Researchers must respect assumptions to ensure results stand on firm ground.
What challenges have you faced when analyzing Likert data? Share in the comments below.
References
Jamieson, S. (2004). Likert scales: how to (ab)use them. Medical Education, 38(12), 1217–1218.
Boone, H. N., & Boone, D. A. (2012). Analyzing Likert data. Journal of Extension, 50(2).

