Statistics plays a critical role in data analysis, research, business intelligence, and scientific decision-making. Modern organizations rely on statistical methods to interpret data and forecast outcomes.
Two primary branches of statistics dominate analytical practice:
- Descriptive Statistics
- Inferential Statistics
Both methods work together but serve different purposes. Descriptive statistics explain what the data shows. Inferential statistics predicts what the data means for a broader population.
Understanding their differences improves research accuracy, data interpretation, and decision quality.
What is Descriptive Statistics?
Descriptive statistics focuses on summarizing and organizing datasets. It describes the main characteristics of collected data.
Researchers use descriptive methods to transform raw data into meaningful insights.
Key Functions
Descriptive statistics helps to:
- Organize raw data
- Identify patterns
- Summarize distributions
- Present results visually
Common Measures
Typical descriptive statistical measures include:
Measures of Central Tendency
- Mean
- Median
- Mode
Measures of Variability
- Range
- Variance
- Standard Deviation
- Interquartile Range (IQR)
Graphical Representations
- Histograms
- Pie charts
- Box plots
- Bar charts
These tools help researchers interpret dataset characteristics without making broader generalizations.
What is Inferential Statistics?
Inferential statistics goes beyond data description. It uses sample data to draw conclusions about a larger population.
Researchers rarely collect data from entire populations. Instead, they analyze representative samples. Inferential statistics estimates population parameters and tests hypotheses.
Core Objectives
Inferential statistics allows researchers to:
- Predict future outcomes
- Test research hypotheses
- Estimate population parameters
- Identify relationships between variables
Common Techniques
Widely used inferential statistical techniques include:
- Hypothesis testing
- Regression analysis
- ANOVA (Analysis of Variance)
- Confidence intervals
- Probability distributions
These methods support evidence-based decision-making in science, business, healthcare, and economics.
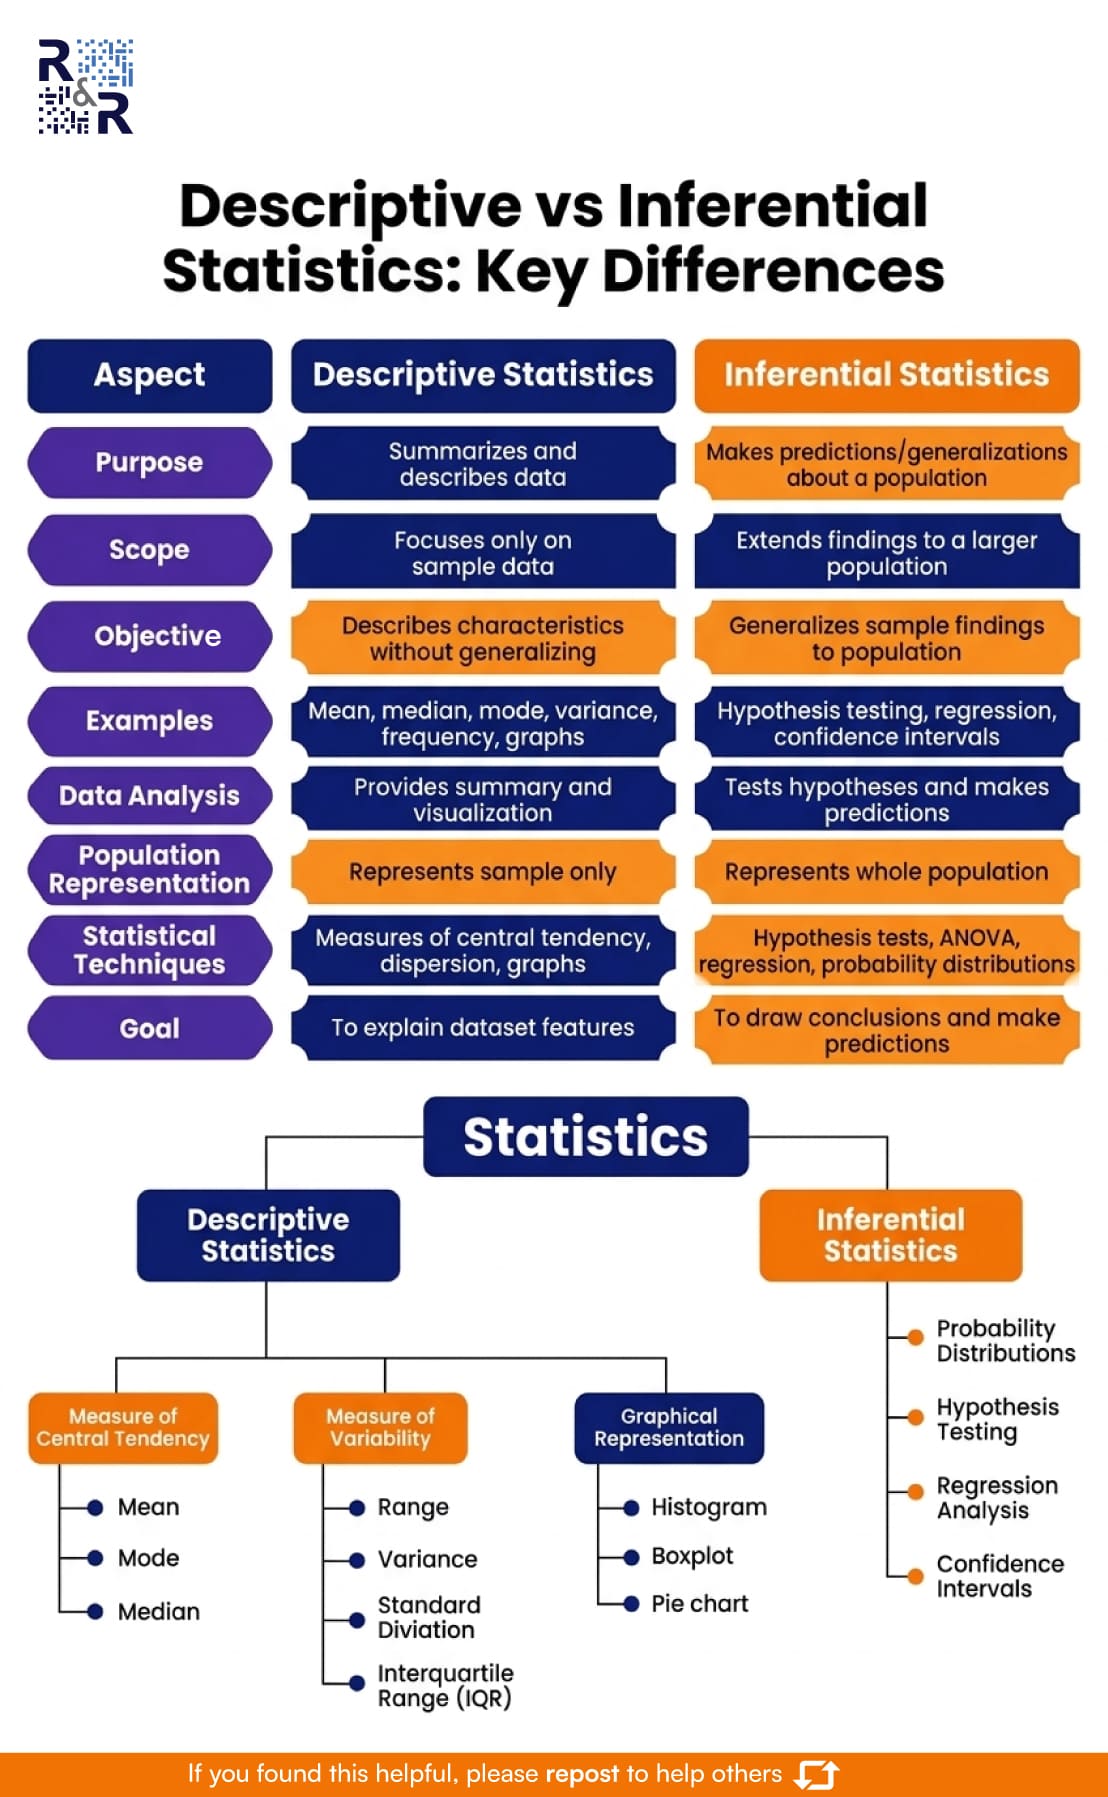
Descriptive vs Inferential Statistics (Key Differences)
| Aspect | Descriptive Statistics | Inferential Statistics |
|---|---|---|
| Purpose | Summarizes data | Makes predictions |
| Scope | Focuses on dataset | Generalizes to population |
| Objective | Describe characteristics | Draw conclusions |
| Methods | Mean, median, graphs | Regression, hypothesis tests |
| Output | Data summaries | Predictions and insights |
Why Both Statistical Methods Matter
Descriptive and inferential statistics complement each other in research.
Descriptive Statistics Helps
- Understand dataset structure
- Detect anomalies
- Communicate results clearly
Inferential Statistics Helps
- Validate research hypotheses
- Predict trends
- Support strategic decisions
For example:
A researcher may summarize survey results using descriptive statistics. Then they test hypotheses about population behavior using inferential statistics.
Real-Life Examples of Descriptive vs Inferential Statistics
Understanding statistics becomes easier when we see how it works in real situations. Below are practical examples from business, healthcare, education, and technology.
Example 1 — Business Sales Analysis
A retail company analyzes its monthly sales data.
Descriptive Statistics
The company summarizes last year’s sales.
Examples:
- Average monthly sales = $120,000
- Highest sales month = December
- Lowest sales month = February
- Bar charts show monthly revenue trends
These statistics describe the past performance of the company.
Inferential Statistics
The company then predicts future sales.
Examples:
- Predict next year’s sales using regression analysis
- Estimate customer demand using confidence intervals
- Test whether a marketing campaign increased sales using hypothesis testing
This analysis helps managers make strategic decisions.
Example 2 — Healthcare Research
A hospital studies patient recovery times after surgery.
Descriptive Statistics
Researchers summarize collected patient data.
Examples:
- Average recovery time = 8 days
- Median recovery time = 7 days
- Recovery time distribution shown in a histogram
These numbers describe patient outcomes in the dataset.
Inferential Statistics
Researchers evaluate treatment effectiveness.
Examples:
- Compare recovery times between two treatments using ANOVA
- Predict recovery probability for future patients
- Estimate population recovery time using confidence intervals
This helps doctors recommend the most effective treatment.
Example 3 — Education Performance
A university evaluates student exam results.
Descriptive Statistics
The institution summarizes exam scores.
Examples:
- Average score = 72%
- Highest score = 95%
- Score distribution displayed using box plots
These statistics explain how students performed in the exam.
Inferential Statistics
The university studies broader academic trends.
Examples:
- Predict performance of future students
- Test whether a new teaching method improved scores
- Estimate average performance of the entire student population
This helps universities improve curriculum design.
Example 4 — Social Media Analytics
A digital marketing team analyzes engagement data.
Descriptive Statistics
The team summarizes campaign metrics.
Examples:
- Average engagement rate = 5.4%
- Total impressions = 250,000
- Most popular post type = video content
These numbers explain campaign performance.
Inferential Statistics
Marketers predict audience behavior.
Examples:
- Predict future engagement using regression models
- Estimate the probability of a post going viral
- Test which content type performs best
This helps marketers optimize marketing strategies.
Example 5 — Election Polling
Polling organizations survey voters before elections.
Descriptive Statistics
Pollsters summarize survey responses.
Examples:
- Candidate A support = 48%
- Candidate B support = 44%
- Undecided voters = 8%
These statistics describe survey results only.
Inferential Statistics
Pollsters estimate national voting outcomes.
Examples:
- Predict election results using sampling models
- Estimate margin of error
- Calculate probability of candidate victory
This helps analysts forecast election outcomes.
Why Real-Life Examples Improve Understanding
Examples bridge the gap between theory and practice.
They help readers:
- Visualize statistical applications
- Understand analytical decisions
- Apply statistics in real situations
Conclusion
Descriptive and inferential statistics form the foundation of modern data analysis.
Descriptive statistics organizes and explains data. Inferential statistics transforms data into predictions and conclusions.
Researchers, analysts, and decision-makers must understand both methods to make accurate, data-driven decisions.
Question
How do you apply descriptive or inferential statistics in your research or work projects?
Share your experience in the comments.
References
- OpenStax Statistics
https://openstax.org/details/books/introductory-statistics - NIST Engineering Statistics Handbook
https://www.itl.nist.gov/div898/handbook/ - Khan Academy Statistics
https://www.khanacademy.org/math/statistics-probability - American Statistical Association
https://www.amstat.org - Montgomery & Runger, Applied Statistics and Probability for Engineers
https://www.wiley.com
Want research service from Research & Report experts? Please get in touch with us.